Saturday, April 28, 2018

What's there in wine ? Part 2 PCA- validating with SPSS Modeler

Are you curious?
Will  the data set which was analysed in  Python, when tested with spss modeler give the same result?
The data of Wine and its components were given as input to the spss modeler. The process which were done in the python was done in spss modeler.( Scaling,and partition).

The same input conditions were given, keeping the customer segment as the target variable.
Feature scaling :( x- min(x)/ range (x)


The choice of the factors was done on based on the  results of python 55 % variance.


Partition : 80-20  --> Training to testing

Number of components: 2 ( the factors which were 14 were shrunk to 2)


A filter node is connected to the nugget to filter only the factors and the customer segment to perform the logistic regression.
Finally the analysis node give the results in the form of a confusion matrix.
Let us see in detail.


Here are the results .

The confusion matrix,


So what is to be  noted ?


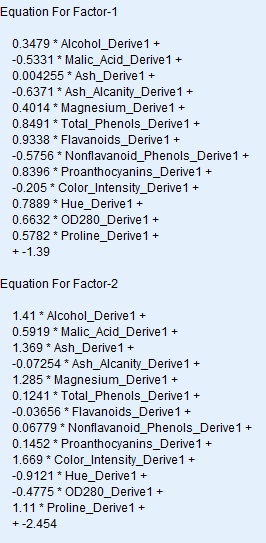
  • The variables which were 14 in number were reduced to two factors
  • The equation of two factors were given above.
  • The logistic regression models gives the results with an accuracy of 97.23 %
  • The prediction of spss modeler for the testing set is perfect with a misclassifier of just 1 which is the same as the python.( the previous post)
Post your comments and views.

Thursday, April 26, 2018

What’ there in wine ? Principal component analysis problem- Data analytics


­
What’ there in wine ?
Which wine is suitable for a typical customer segment and what are their preferences ?
The  objective behind it is to understand the mathematics, and the datascience part behind it. This model can be replicated to any other similar business problem .
Here is a classical problem to understand the PCA- Principal component analysis. There are 178 records, 12 variables ( components to prepare the wine), which is distributed for three categories of customers.

Problem statement: Need to identify which are the variables that contribute to the preference of the customer. Identify the variables which has the maximum variance. Visualize the learning of the machine.
The task is to classify the category of customers and their taste. For each new wine the model will be used to predict to which customer segment this could be recommended.
This is an example for unsupervised learning , where we ask the machine to learn on its own without giving any instructions in between the program.
Let’s dive deep


Importance of PCA
            1.Chooses “m” variables out of “n “, where  m < n
            2. The chosen m variables explains the most of the variance in the dataset.
Now let us workout this problem in python.
As a standard process,

  •      Divide the dataset into test set and training set, where the learning made using the training set is plugged in the test set to see the results.
  • ·        Scaling the data to have uniform distance between them and the other variables. Where there are a number of modes to do scaling, here I have preferred to use standard scaling. This is available as a package  in python in sklearn.

  •  Import the PCA. Initially set the no. of components as None and after viewing the results of the PCA, we could decide the number of variables.
  •   Here it is decided as two variables which had maximum variance.
  •  After  we have got the top two variables , we shall use the logistic regression to identify the effectiveness and check whether it has classified as planned.
  •  Let us see the results, the confusion matrix.
  •     We have got a wonderful results as it has predicted 0 as 0 in 14 occasions, 1 as 1 in 15 , and 2 as 2  in 6, with a misclassification of one occassion. 
  • ·     Use matplotlib to visualize the results.


Monday, April 16, 2018

How to start a Natural Language Processing- Part 1

Well, you need to understand your business,
You are getting feed back from your customers , the feed back is  in the form of text and there is a question at the last,  an objective question, yes/ no type or  will you recommend or not type.
 You have say a 1000 s of such feed backs. Do you think it is easy for a human being to sort, find and get the sentiments of your customers ?
Here comes the algorithm of NLP- Natural Language Processing.
Python is used to understand the scenario.
Pre processing the input data 
Before you input the data make sure you give the tsv, ie the tab separated file , TSV file as the CSV contains comas which the classifier mis interprets it. Secondly make sure you use a code to avoid the double quotes, "quoting=3".
Clean the text

  1. Choose the appropriate words that reflect the positive sentiments  such as like, love, happy ,etc [ the tenses liked , loved  should be grouped  to get minimum no. of words for computation]
  2. use the library function re ie. import re
  3. re.sub() function will help to remove the special characters
  4. lower() function converts all the characters into lower characters
  5. Till now we have seen that we need to get a sentence, remove the special characters, convert into lower cases.
  6. Convert the sentences into words. use a package nltk which does this function.
  7. use stopword to choose only the relevant word in the language which represent the sentiment
  8. We need to separate the steam and the root word . For instance , liked need to be taken as 'like'.  as separate function PorterStemmer is available for this activity.


Friday, April 13, 2018

What are your chances to get a PGP Management call from IIM A ?

Here is a detailed analysis done to understand the past history of admission process of IIM Ahamedabad. This analysis is done in tableau, which I was thoroughly enjoying while doing it.

While it is not necessary that the same pattern repeats, this could be considered as a reference while someone prepares for it.

Most of the time spent was to make the  data understandable by the machine,convert those as measures and dimensions, formating the data type etc.

How many apply for a batch ?? 
The next visualisation can help us to understand the potential chances of being a female / an engineer/ Master's professional.

Sector wise analysis of People joined


What minimum gmat score is required ? what was the past ?


Disclaimer: The data was fetched from the open source from their website, the author claims no liability for the individual's course of action. While  atmost care is taken for the analysis, ensuring the accuracy of the information is one's own responsibility .

Monday, April 2, 2018

Power of sas visual analytics

Wouldn't it be wonderful if you were given a set of data of some 1500 staff  and identify the reasons for attrition.
SAS visual analytics has the ability to predict the  classification / combination with a level of accuracy. A sample work is done to understand the software's performance. Simply reduced tonnes of workload.
Partition- 70-30% training and validation


A sample probability  of a particular combination of parameters is given in below figure