Showing posts with label spss modeler. Show all posts

Saturday, April 28, 2018

What's there in wine ? Part 2 PCA- validating with SPSS Modeler

Are you curious?
Will  the data set which was analysed in  Python, when tested with spss modeler give the same result?
The data of Wine and its components were given as input to the spss modeler. The process which were done in the python was done in spss modeler.( Scaling,and partition).

The same input conditions were given, keeping the customer segment as the target variable.
Feature scaling :( x- min(x)/ range (x)


The choice of the factors was done on based on the  results of python 55 % variance.


Partition : 80-20  --> Training to testing

Number of components: 2 ( the factors which were 14 were shrunk to 2)


A filter node is connected to the nugget to filter only the factors and the customer segment to perform the logistic regression.
Finally the analysis node give the results in the form of a confusion matrix.
Let us see in detail.


Here are the results .

The confusion matrix,


So what is to be  noted ?


  • The variables which were 14 in number were reduced to two factors
  • The equation of two factors were given above.
  • The logistic regression models gives the results with an accuracy of 97.23 %
  • The prediction of spss modeler for the testing set is perfect with a misclassifier of just 1 which is the same as the python.( the previous post)
Post your comments and views.

Sunday, March 25, 2018

Indian car buyer's behaviour- using SAS VISUAL ANALYTICS

Here is an interesting insight of  car buyer's pattern.
A sample of 99 cars is analysed. 13 variables. Have a look of the data audit done using SPSS Modeler.


Now comes the slicing and dicing part.
We can observe that the a post graduate whose wife is working has a more chance of buying a car. 
secondly compared to the education level post graduates bought the higher percentage of cars.


The box plot below gives an idea about the salary range, mean , median, mode, make of the car and its count. An example of good visualisation in one graph.


Does Home loan has an impact ? find the answer below...


What is the impact of count when it comes to home loan ?


Thanks Ramprsath for support and technicals

Monday, March 12, 2018

Using spss modeler- data type issues

A typical example of data cleansing

There are chances that we encounter issues with the conversion of data types .
A file of type csv need to be given as a source of input to spss modeler for analysis.
Except the first column all other column contains numbers- integers/ float or decimals.
But surely of non character data types.
When the source file is added , the type of data  is displayed as nominal instead of integer.

What to do with this kind of issue ? How to handle it ?

  1.  Check the various options given in the source node- var
  2. There are possibilities that space, tab were checked. Need to decide whether those are required.
  3. Analyse the source data whether any special characters were added. Ex- comma, semi colon, hyphen etc. These create troubles for the modeler to understand the type of data.
  4. If needed delete those without  loosing the context of data or rename it if needed.
  5. These four simple steps  can make the data pure of its form
  6. After keying in the file to the modeler, check whether the required data type is understood by the software. Now it is possible to change/ modify , add dummies, and edit according to our need. 
Learning from the experience  through blogs, forums saves lot of time in the during data modeling.

Saturday, March 10, 2018

Working with data which has 1 lakh records

An interesting point of entry...

So you have decided to put your hands on in analysing the data which has atleast one lakh 1,00,000 records, ie one lakh rows in an excel sheet with 'n' number of columns.
How should you start with ?
A typical example I have worked is a unsupervised learning process.
Go with baby steps doing as follows
1. Use cross tabs- find the relation between the columns. There may be a relation between column three and column 5. Any visualization tool like- R, Spss modler, tableau can give this.
2. Use box plots to find out the skewness of the variables. Variables are the the headers of the column.


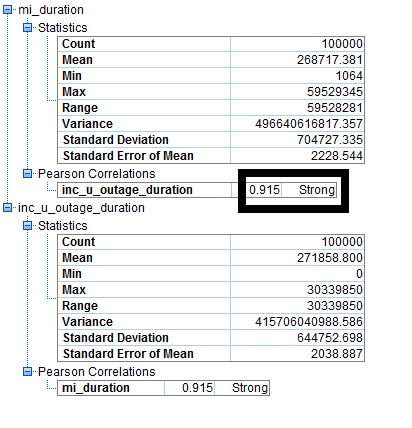
3. Find the correlation between the variables. It may be strong, medium or weak. If the correlation is strong then we could  discard one of the variables.

4. Forming clusters- using suitable algorithm- say K - Means cluster try using two clusters and check the cluster quality. If the cluster quality is less than 0.5 it means that there are few more possibilities of clusters.


5. Try increasing the clustering of the of the variable data points,till an optimum value of clusters are obtained.
6. Understand the variables that drive the data. If the drivers are categorical regression analysis is not the best mode to analyse.
7. A frame work for clustering is given as below- Modelled in spss modler.
8. The above is the exploration process. Now identify the drivers and proceed with the model.