So you have decided to put your hands on in analysing the data which has atleast one lakh 1,00,000 records, ie one lakh rows in an excel sheet with 'n' number of columns.
How should you start with ?
A typical example I have worked is a unsupervised learning process.
Go with baby steps doing as follows
1. Use cross tabs- find the relation between the columns. There may be a relation between column three and column 5. Any visualization tool like- R, Spss modler, tableau can give this.
2. Use box plots to find out the skewness of the variables. Variables are the the headers of the column.

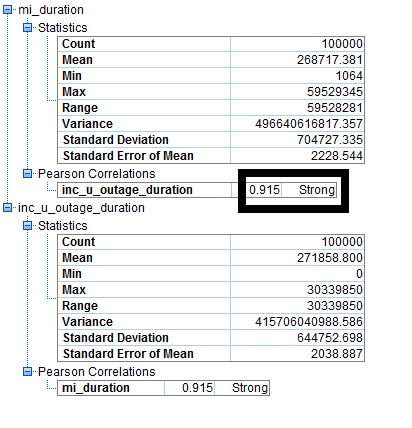
3. Find the correlation between the variables. It may be strong, medium or weak. If the correlation is strong then we could discard one of the variables.
4. Forming clusters- using suitable algorithm- say K - Means cluster try using two clusters and check the cluster quality. If the cluster quality is less than 0.5 it means that there are few more possibilities of clusters.

5. Try increasing the clustering of the of the variable data points,till an optimum value of clusters are obtained.
6. Understand the variables that drive the data. If the drivers are categorical regression analysis is not the best mode to analyse.
7. A frame work for clustering is given as below- Modelled in spss modler.

No comments:
Post a Comment