The current technology gives directions to this. Today with the computing capability of the latest machines/ highly advanced software tools / development of human brain makes it possible.
Supposing we have a data set to understand the churn behaviour of the customer from one service provider to another.
For instance we have the following data about the customer
State
|
Eve Calls
|
Account Length
|
Eve Charge
|
Area Code
|
Night Mins
|
Phone
|
Night Calls
|
Int'l Plan
|
Night Charge
|
VMail Plan
|
Intl Mins
|
VMail Message
|
Intl Calls
|
Day Mins
|
Intl Charge
|
Day Calls
|
CustServ Calls
|
Day Charge
|
Churn?
|
Eve Mins
|
The first objective is to predict whether the customer will sustain with the telecom provider.The second objective is to understand which category of customers will tend to churn.
Where will we start?
1. First understand the type of data. Account length -say in days-- so integer - continuous variable
2. Classify what kind of variables these belong to--> continuous, nominal, categorical, ordinal etc
3. Fix the target variable- in our case it is the churn- > Yes / NO.
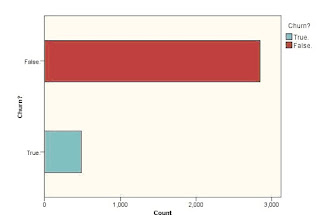
4. Get the statistics of the churn customers.
5. Fix the drivers- ie the variables which lead to the decision.
Look at the example.
In the above , the four variables are narrowed down and fixed as drivers.
6. Use suitable alorithms to solve the problem. A typical algorithm that can be used is Classification and regression tress- C & RT / CART algorithm.
7. SPSS Modeler has an option to make the tree grow interactively. Starting with the major driver- (from any of the above variables), and drilling down further can give lot of insights to the problem.


No comments:
Post a Comment